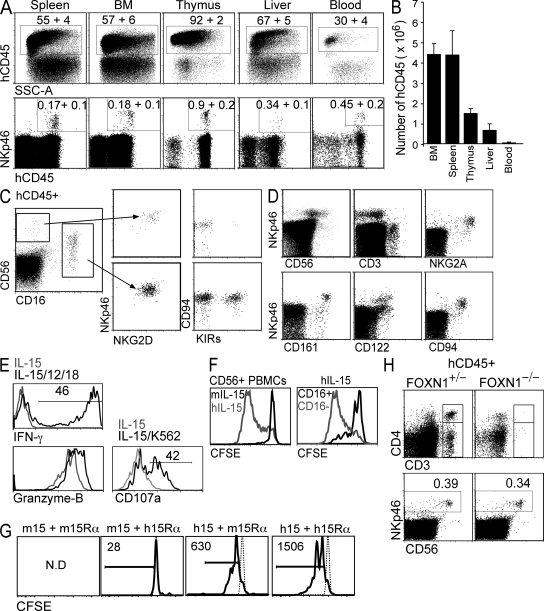
Figure 1.
NK cells develop and populate various lymphoid tissues in HIS mice. (A) 8 wk after CD34+CD38− HSC engraftment, various organs from HIS mice were analyzed for human NK cell reconstitution by flow cytometry (human CD45; hCD45). FACS plots are representative. Values represent mean percentage ± SEM of eight mice. (B) The cellularity of the indicated organs was enumerated and the number of hCD45+ cells was determined based of flow cytometry data. Numbers of cells in bone marrow (BM) are per femur and in blood are per milliliter. Values represent mean ± SEM of eight mice. Human NK cells were analyzed in the thymus (C) and spleen or bone marrow (D) by flow cytometry using antibodies against the indicated human antigens. Events shown were pre-gated on hCD45+. FACS plots are representative of eight HIS mice, with a total of three different donor HSCs represented. (E) 5 × 10⁴ CD56+ NK cells were purified from spleen and bone marrow of HIS mice and stimulated in vitro with IL-12 and -18 or 5 × 10⁵ K562 CML cells in the presence of IL-15 for 18 h. Cells were stained with anti-CD107a or fixed, permeabilized, and stained with anti–IFN-γ or anti–granzyme B and analyzed by flow cytometry. (F) 2 × 10⁵ CD56+ NK cells purified from human peripheral blood were labeled with CFSE and cultured in hIL-15 (gray line) or mIL-15 (black line) for 120 h. CFSE histograms of CD56loCD16+ (black line) and CD56hiCD16− (gray line) cultured in hIL-15 are also shown. (G) 104 CD56+ NK cells purified from human peripheral blood were labeled with CFSE and cultured with the indicated combinations of human (h) and mouse (m) IL-15 (15) and IL-15Rα-Fc (15Rα) for 72 h. Cells were analyzed by flow cytometry. Numbers indicate live cells (PI−) per well. N.D., not determined because there were no live cells. Histograms are representative of two individual experiments using different donor blood. (H) 8 wk after CD34+CD38− HSC engraftment, FOXN1+/− and FOXN1−/− (Nude) HIS mice were analyzed for human T and NK cell reconstitution by flow cytometry. FACS plots are gated on hCD45+ cells in spleen (top) and BM (bottom) and are representative of three mice of each genotype.

