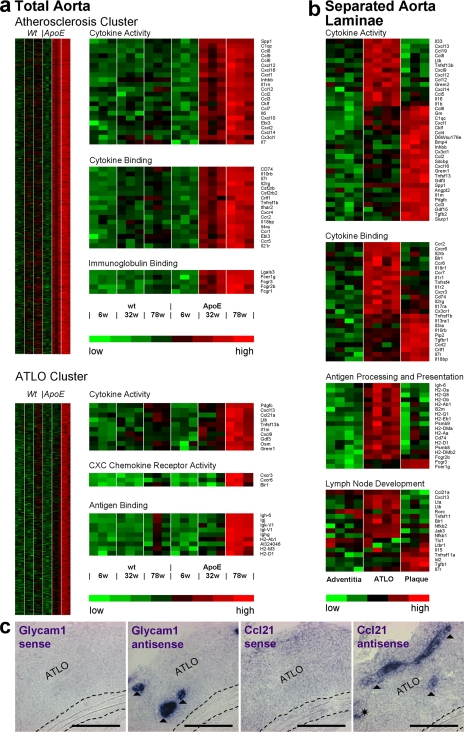
Figure 4.
Lifespan aorta gene expression profiling identifies candidate atherosclerosis versus ATLO genes. Microarrays were prepared from total aortae of individual mice of each genotype (total aorta in a) or from LCM-derived tissues (separated aorta laminae in b). Differentially regulated probe sets were identified as described in Materials and methods. Probe sets specifying genes with the highest signal strengths are displayed. (a) Atherosclerosis cluster displays genes up-regulated between 6 and 32 wk; heat maps at right indicate significantly up-regulated genes (unpaired Student's t test; P < 0.05) of GO terms cytokine activity, cytokine binding, and immunoglobulin binding. ATLO cluster displays genes up-regulated between 32 and 78 wk; heat maps at right indicate significantly up-regulated genes of GO terms cytokine activity, CXC chemokine receptor activity, and antigen binding, (b) Heat maps display LCM preparations of adventitia without plaque or ATLO (left; n = 4 mice), ATLOs (adventitia adjacent to intima plaque; middle; n = 4 mice), or intima plaques (right; n = 3 mice). GO terms for cytokine activity, cytokine binding, antigen processing and presentation, and LN development were examined. (c) Glycam1 and Ccl21 mRNA in situ hybridization analyses of ATLO-burdened abdominal aorta segments. Sense and antisense cRNA probes were generated, and in situ hybridization analyses were performed (filled triangle, HEV; asterisk, lymph vessel). Media and lesions did not show specific Glycam1 or Ccl21 mRNA signals. Broken lines designate media. Bars, 100 μm.

