Figure 5.
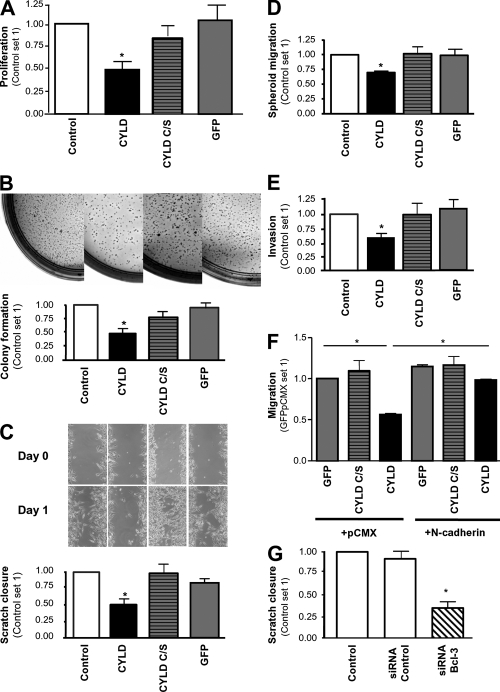
CYLD regulates proliferation and N-cadherin–mediated migration and invasion. (A) Proliferation of Mel Im cells expressing CYLD, CYLD C/S, or GFP versus the parental Mel Im cell line (Control) after 72 h. Data are given as mean ± SEM. *, P < 0.05. (B) Colony formation in soft agar 3 wk after plating 104 Mel Im cells expressing CYLD, CYLD C/S, or GFP versus the parental (Control) cell line. (C) Migration of melanoma cells in monolayer scratch assays. Mel Im cells transduced with lentiviral vectors carrying CYLD, CYLD C/S, or GFP and noninfected control cells (Control) were used. Representative pictures (at day 0–2) and calculation (mean ± SEM; *, P < 0.05) of the areas between scratch fronts (after 2 d). (D) Migration of Mel Im cells (Control) compared with CYLD, CYLD C/S, or GFP stably transduced cells in spheroid migration assays. Data are given as mean ± SEM. *, P < 0.05. (E) Invasion of Mel Im (Control) cells compared with CYLD, CYLD C/S, or GFP stably transduced cells (after 24 h) in Boyden chamber assays. Data are given as mean ± SEM. *, P < 0.05 compared with Control and GFP. (F) Migration of melanoma cells in Boyden chamber assays. Comparison of Mel Im cells stably transduced with CYLD, CYLD C/S or GFP, and transiently cotransfected with an N-cadherin expression vector (+N-cadherin) or control vector (+pCMX). Data are given as mean ± SEM. *, P < 0.05. (G) Migration of melanoma cells in monolayer scratch assays. Comparison of nontransduced Mel Im cells (Control), cells transfected with BCL-3 siRNA nucleotides (siRNA BCL-3), or scrambled siRNA control (siRNA Control). Data are given as mean ± SEM. *, P < 0.05 compared with Control or siRNA control. Experiments in A–G were repeated at least three times.

