Figure 6.
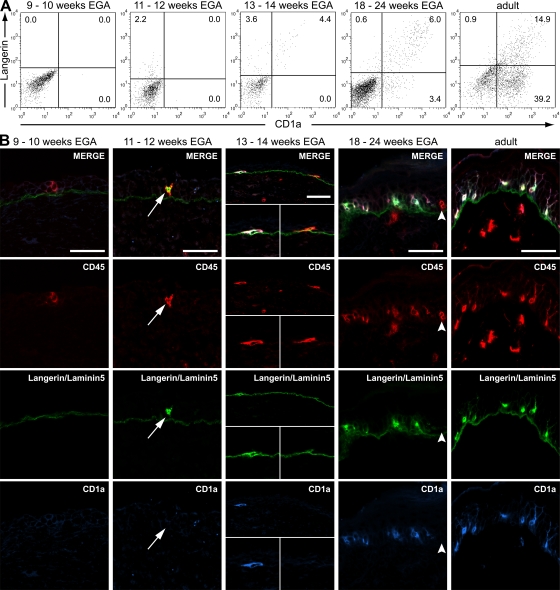
Epidermal leukocytes sequentially acquire Langerin and CD1a. CD1a and Langerin expression in developing skin was assessed by flow cytometry (A) and immunofluorescence (B). (A) Dot plots are representative of three to five experiments per group and show the development of CD45+HLA-DR+ cells with regard to the expression of CD1a and Langerin (1,200–2,400 cells displayed). (B) The first Langerin+CD1a− LC precursors are identified by immunofluorescence at 11 wk EGA (second column, arrows). CD1a expression is found on some (middle, left insets) but not all (middle, right insets) CD45+Langerin+ cells at 13 wk EGA. Arrowheads denote a CD45+Langerin−CD1a− LC precursor. Data are representative of at least three experiments per group. Bars, 50 μm.

