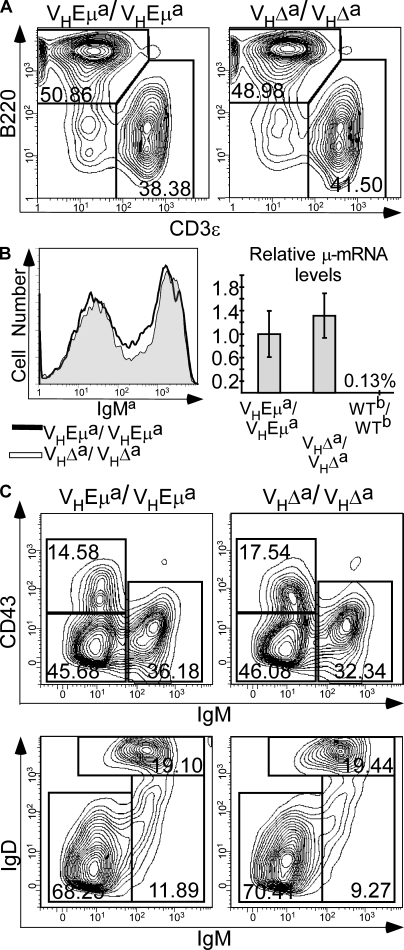
Figure 2.
Spleen and BM B cell profiles in homozygous VHEμa and VHΔa mice. (A) Flow cytometry profiles of splenic lymphocytes from adult mice stained for B220 (B cell marker) and CD3-ε (T cell marker). (B) Surface IgMa and relative Igμ transcript levels in splenic B cells. Left, histogram of spleen cells stained with antibody to IgMa. Right, quantitative RT-PCR results, using primers for B1-8i μ mRNA and normalized to hgprt1 mRNA (see Materials and methods). μ mRNA from VHEμa B cells are set as 1.0 and WTb/WTb is the negative control. (C) BM B cell subsets. Top, BM cells gated for B220+ cells and analyzed for CD43 and IgM expression. Bottom, BM B220+ cells analyzed for IgD and IgM. Data shown are representative of three animals of each genotype.

