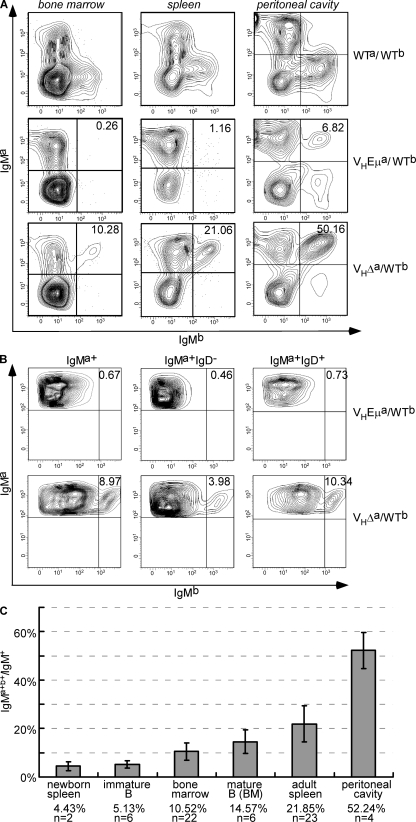
Figure 3.
IgM allotype expression in VHEμa/WTb and VHΔa/WTb mice. (A) Flow cytometry profiles of lymphocytes in BM, spleen, and the peritoneal cavity, stained with antibodies to IgMa and IgMb. (B) IgM allotype expression on immature and mature B cells of BM (enriched for B220+ cells). Plots are of cells gated for IgMa alone (left), cells that were IgMa+ and IgD− (middle; immature B cells), or IgMa+ and IgD+ cells (right; mature B cells) and then analyzed for IgMa and IgMb. In both A and B, the number in top right quadrant = (percentage of double-positive cells)/(total IgM+ cells). (C) Percentage of IgMa+b+/IgM+ cells at different stages of development and in different tissues. n = number of mice analyzed. Error bars show SD.

