Figure 6.
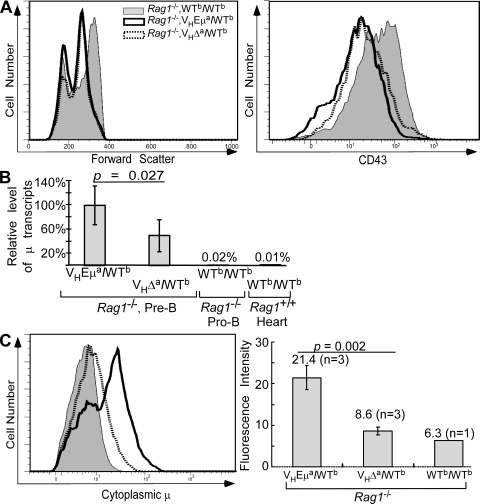
Igμ transcription and cytoplasmic Igμ protein levels in pre-B cells of mutant mice. (A) B220+ lymphocytes from BM of Rag1-deficient WTb/WTb, VHEμa/WTb, and VHΔa/WTb mice were analyzed for size (forward scatter) and for CD43 expression by FACS. Data shown are representative of three individual mice of each genotype analyzed. (B) Igμ mRNA levels in cells shown in A. Data were generated by quantitative RT-PCR, normalized to hgprt1 mRNA, and included two experiments, analyzing a total of five individual animals of each genotype. Negative controls were mRNA isolated from pro-B cells of a WTb/WTb Rag1−/− littermate and mRNA from C57BL/6 heart tissue (WTb/WTb, Rag1+/+). Statistical significance (P = 0.027) was obtained by a two-tailed Student's t test. Error bars show SD. (C) Cytoplasmic Igμ levels in B220+ BM cells of Rag1−/− mice. Left, histograms of cytoplasmic Igμ. Right, mean Igμ fluorescence in pre-B cells from multiple mice (n = number of mice analyzed). Error bars show SD.

