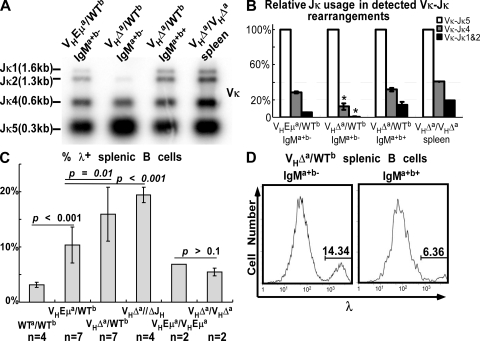
Figure 7.
Light chain editing in IgMa+b− cells of VHΔa/WTb mice. (A) Vκ-Jκ rearrangement analyses. PCR products detected with Jκ5 probe (see Materials and methods). (B) Quantitative analysis (ImageQuant) of blot shown in A and a repeat experiment. Detected Vκ-Jκ4 and Vκ-Jκ1 and 2 products were normalized to those for Vκ-Jκ5. *, P < 0.05 by a two-tailed Student's t test. Pie charts in Fig. S3 (available at http://www.jem.org/cgi/content/full/jem.20081202/DC1) show the relative increase in Vκ-Jκ5 rearrangements in IgMa+b− B cells from VHΔa/WTb animals. Error bars show SD. (C) λ+ splenic B cells in WT and mutant mice. Spleen cells were stained for both Igκ and Igλ and the percentage of λ+ cells was calculated as λ/(κ+λ). Genotypes are provided below bars. Data were pooled from four experiments. n = number of mice analyzed. P-values were calculated by a two-tailed Student's t test. Error bars show SD. (D) Histogram of cells stained for μa, μb, and λ. Left, single producers (IgMa+b−) from VHΔa/WTb mice; right, double producers (IgMa+b+) from VHΔa/WTb mice.

