Fig. 1.
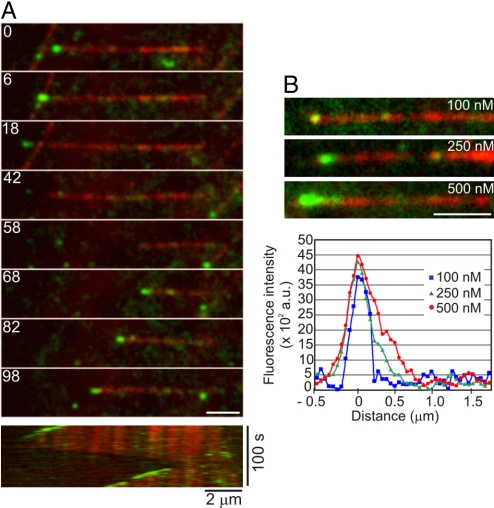
Microtubule plus-end tracking by the human EB1 protein. (A) Montage depicting the specific decoration of growing microtubule plus-ends by 250 nM EB1–Alexa 488. The kymograph at the bottom shows the same microtubule over the duration of the observation period. Microtubule depolymerization is accompanied by loss of EB1–Alexa 488 at the plus-ends, and subsequent rescue of microtubule growth restores plus-end tracking of EB1–Alexa 488. The numbers on each frame represent time in seconds. (B) Images showing the microtubule plus-end decoration pattern at increasing concentrations of EB1-Alexa 488. (Scale bar, 2 μm). The graph shows the corresponding distribution of the fluorescence intensity of EB1–Alexa 488 at the microtubule tip.

