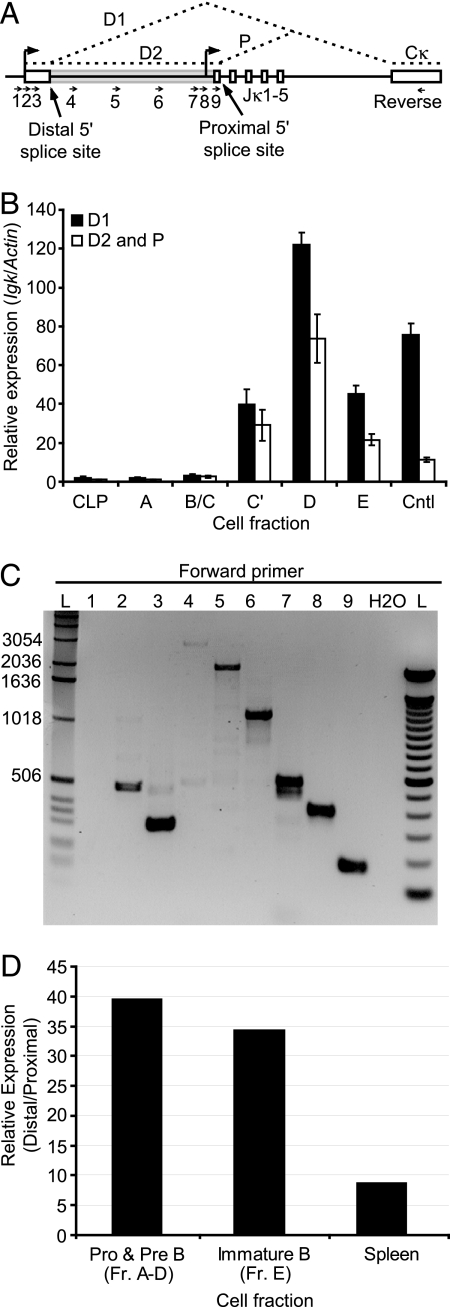
Fig. 3.
The distal germline Jκ promoter is far more active than the proximal germline Jκ promoter in developing pre-B cells. (A) Schematic of the Jκ cluster. The transcription start sites for both the distal and proximal promoters are shown as arrows above the diagram along with the deduced splicing pattern of the germline transcripts in dashed lines. The unfilled box at the left represents the first exon of one of the distal-promoter transcripts (D1), and the gray box the first exon of the other (D2). The two different splice donor sites are indicated. Approximate primer locations for both real-time RT-PCR (B) and gel-based RT-PCR (C) of Jκ transcripts are shown as small arrows. (B) Quantitative real-time PCR analysis of spliced Jκ germline transcripts in sorted B cell subsets from wild-type mice. Distal promoter transcripts were quantified using primer #3 (transcript D1) or primer #9 (transcript D2) paired with the reverse primer in Cκ. Proximal promoter derived transcripts (transcript P) were quantified using the same primer pair as for the alternatively spliced distal transcript D2. Harvested bone marrow from C57/BL6 mice was labeled as in (Fig. 1B) and sorted by flow cytometry into the indicated fractions before harvesting cells for RNA isolation. Cntl represents a positive control RNA sample from AMuLV transformed pro-B cells. Values were normalized to Actin transcript abundance (± SD). Data are representative of two independent experiments. (C) RT-PCR analysis of Jκ germline transcripts in primary pre-B cells. Pre-B cells from wild-type mice were sorted and processed for RNA isolation and subsequent RT-PCR. Various forward primers (numbered arrows) were paired with a common reverse primer in the Cκ exon. An ethidium bromide-stained agarose gel analysis of the resultant products is shown. Lane marked L is a standard DNA size ladder. Numbers above the lanes indicate the forward primer used according to the diagram in (A). Data are representative of two independent experiments. (D) 5′RLM-RACE analysis of germline Igκ transcripts in developing primary B cells. Primary cells were harvested and sorted from wild-type C57/BL6 mice and processed for RNA isolation and subsequent 5′RLM-RACE (strategy shown in Fig. S3). The graph represents the ratio of transcripts initiating from the distal and the proximal Igκ germline transcript promoters. No significant quantities of either transcript were detected in thymocytes or water controls. Data are representative of two independent experiments, with each PCR done in triplicate.

