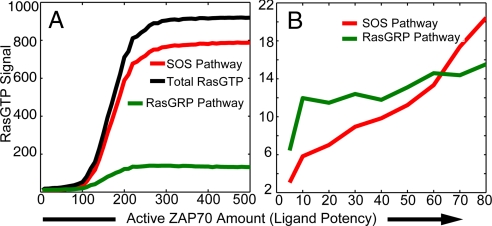
Fig. 4.
The number of RasGTP molecules is shown as a function of ligand potency at 20 min. Each curve represents the average of 100 stochastic simulations and represents the mean behavior of a population of cells. (A) The number of active Ras molecules generated by RasGRP (green), SOS (red), and the total amount (black). (B) The response for weakly stimulatory ligands is shown in amplified form to show that most RasGTP molecules are generated via RasGRP in this regimen and that the response is graded.

