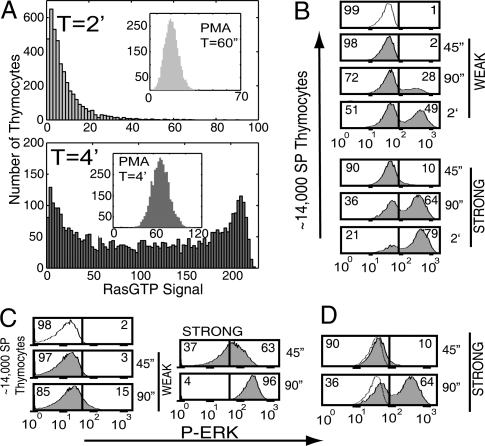
Fig. 5.
Analogue and digital signaling in thymocytes. (A) Histogram of 4,000 computer simulation calculations of the RasGTP signal after “TCR stimulation” by a stimulus of 70 ZAP70 molecules. At 2 min the cells display a unimodal distribution of Ras levels (Top). At 4 min a bimodal distribution emerges. Inset shows the unimodal distribution of Ras activation after addition of 500 molecules of DAG with no ZAP70 (i.e., no TCR stimulation). RasGAP concentration was reduced from that in A to account for their dynamic regulation (23). (B) Analysis of ERK phosphorylation by flow cytometry in CD4 single-positive thymocytes that were stimulated WEAK or STRONG through their TCR for the indicated time points. Cells show an initial shift of the distribution, followed by a bimodal distribution with cells divided between those with low Erk activation and those with high Erk activation. For strong stimulation the bimodality occurs very fast. Numbers indicate the percentage of cells on either side of the divider. (C) Thymocytes stimulated and analyzed as in B, except that stimulation occurs via PMA, a DAG analogue, at a WEAK or STRONG dose. The distribution of cells shifts in an analogue manner to the right at both weak and strong stimulation. (D) Enlargement of “Strong Stimulation” data in B above to show details of the bimodal distribution of cells and the analogue shift at early times. The dotted line represents the ERK phosphorylation in unstimulated thymocytes.

