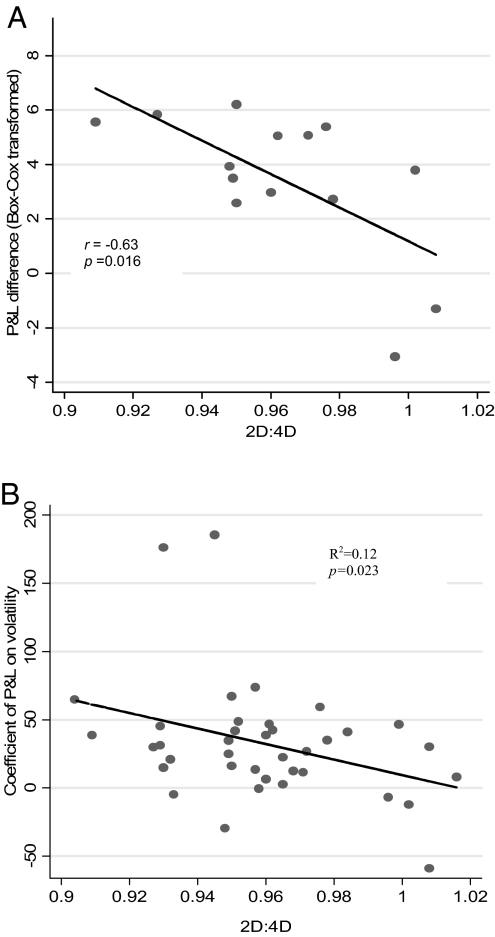
Fig. 3.
Circulating testosterone, volatility, and P&L. (A) The difference in each trader's P&L between days of high and low morning testosterone plotted against their 2D:4D. (B) Traders' 2D:4D plotted against the sensitivity of their P&L to changes in volatility. The plot was derived in 2 stages: First, each trader's P&L, recorded over a 20-month period, was regressed against the volatility of the Euribor futures contract over the same period. The slope of the resulting curve gave us a measure of the sensitivity of each trader's P&L to changes in volatility. Second, the slope of each trader's curve was plotted against his 2D:4D. The two outlier data points were handled by robust regression and did not distort the results.

