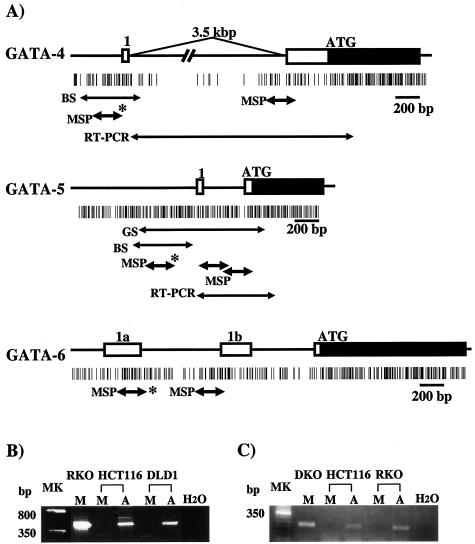
FIG. 2.
Schematic representation of 5′ regions of GATA-4, -5, and -6 and MSP analyses of promoter methylation status. (A) Schematic representation of the genes. The GATA-4 diagram includes a new exon 1, located 3.5 kb upstream of the previously designated exon 1 (identified from EST BG718444), genomic sequences containing this EST (AC090790 and AC069185), and a confirmatory PCR approach showing the EST to be contained in the single transcript amplified for this gene (see panel B). The newly reported GATA5 cDNA (no. NM080473) includes one 5′-untranslated exon (41 bp). This newly identified exon 1 is located 387 bp upstream of exon 2 that contains the translation start site in the genomic GATA-5 sequence (no. AL499627). The data for the genomic structure of GATA-6 (A and B) was obtained from the newly reported sequence of this gene (GenBank no. AC009669), which reveals two 5′-untranslated exons (1a and 1b). Boxes indicate exons, including coding (black) and noncording (white) regions. Vertical bars show CpG sites. Black arrows below the CpG sites indicate the regions analyzed by MSP, genomic sequencing (GS), and bisulfite sequencing (BS) in the present study. The regions analyzed by MSP for which methylation status corresponded to GATA-4, -5, and -6 expression are indicated by an asterisk. (B) RT-PCR analysis of 5′-untranslated region of GATA-4 by using the primer set (see panel A, RT-PCR) in CRC lines. (C) RT-PCR analysis of 5′-untranslated region of GATA5 with the primers designated as in panel A. Lanes (B and C): MK, 50-bp ladder marker; M, mock treatment of cells; A, treatment with DAC; H2O, no RNA added.

