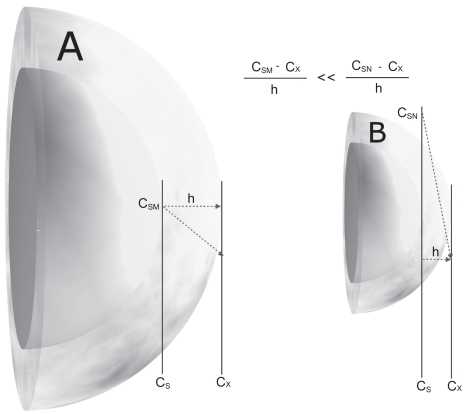
Figure 2.
Comparison of a microcrystal (A) and a nanocrystal (B) and their surface curvature and concentration gradient over the diffusional distance (h).
Abbreviations: cs, drug-saturated water at surface (M, microcrystal; N, nanocrystal); Cx, bulk concentration at diffusional distance; h, diffusional distance. dc/dt ~ (cs − cx)/h.
Used with permission from Junghanns (2006).

