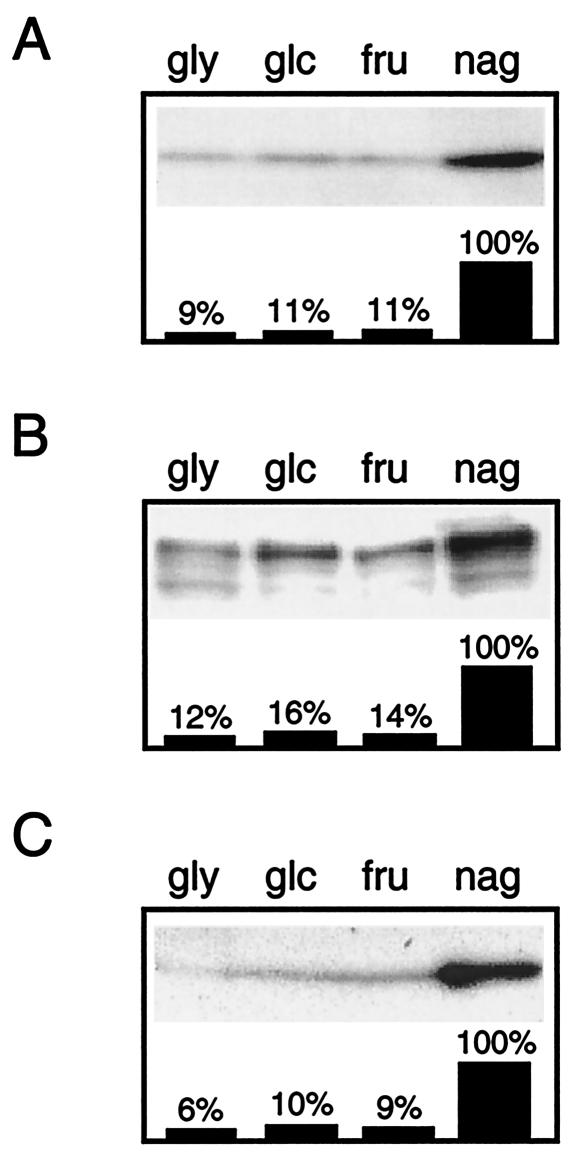
FIG. 3.
Protein levels of IIACrr, EI, and HPr. Western blots of sodium dodecyl sulfate-10% polyacrylamide gels show the immunoreactive signals corresponding to IIACrr (A), EI (B), and HPr (C). Crude cell extracts were prepared from mycelia grown on MM supplemented with 0.1% Casamino Acids and 50 mM glycerol (gly), glucose (glc), fructose (fru), or N-acetylglucosamine (nag). In each lane 5 μg of cellular protein extract was subjected to gel electrophoresis. The bars show the signal quantification of IIACrr, EI, and HPr protein levels obtained by densitometric analysis of the gray scales with the TINA software program (version 2.08; Raytest). The signal value detected in N-acetylglucosamine-grown cells was set to 100%. Similar results were obtained in three independent experiments.

