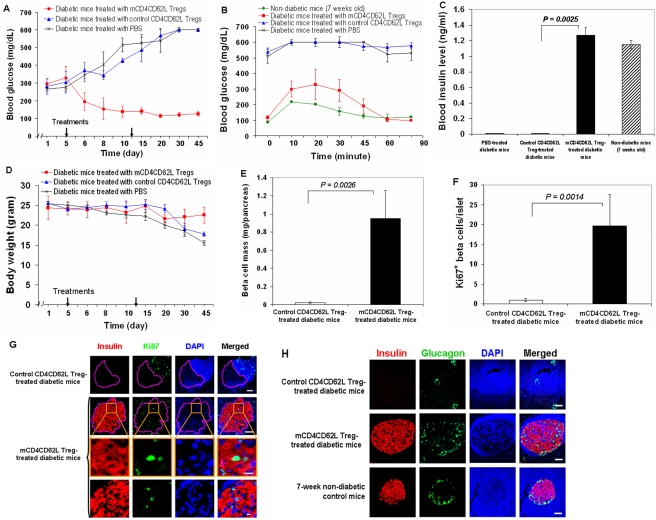
Figure 2. CB-SC-modulated CD4+CD62L+ Tregs (mCD4CD62L Tregs) reverse hyperglycemia in overt diabetic NOD mice.
Mouse spleen lymphocytes isolated from female NOD mice (aged 6–8 weeks) were co-cultured with CB-SC for cell sorting as described in methods. These purified CD4+CD62L+ Tregs (mCD4CD62L Tregs) were used for treatment of spontaneously-developed autoimmune-caused diabetes in NOD mice. The purified CD4+CD62L+ Tregs from lymphocytes not co-cultured with CB-SC (control CD4CD62L Tregs) served as control for mCD4CD62L Tregs. Injection of vehicle PBS served as an additional control (n = 5). (A) The mCD4CD62L Tregs correct hyperglycemia in diabetic NOD mice. Overt diabetic NOD mice were treated with mCD4CD62L Tregs (total 5 million cells/mouse, i.p., red line; representative data are from 6 diabetic mice sensitive to mCD4CD62L Treg treatment with euglycemia, n = 8 mice). Purified control CD4CD62L Tregs served as control (total 5 million cells/mouse, i.p., blue line, n = 5 mice). PBS served as an additional control (black line, n = 5 mice). (B) Intraperitoneal glucose tolerance testing (IPGTT) 3 weeks following the 1st treatment with mCD4CD62L Tregs. Seven-week old NOD mice served as normal control. (C) Determination of blood insulin levels by ELISA. (D) Effect of treatment on mouse body weight. (E–H) Pancreatic histology analyses: Pancreata from mCD4CD62L Treg-treated diabetic mice and control mice were collected for immunohistochemistry after observation for 45 days. Representative sections are shown in each panel (G, H). (E) Morphometric analysis of pancreatic β-cell mass. Pancreatic β-cell mass was determined by point-counting morphometry on insulin-positive islet β cells followed by immunostaining with guinea pig anti-insulin Ab (Dako) and counter-staining with hematoxylin. (F) Quantification of Ki67-positive cells in pancreatic islets after double immunostaining with Ki67 and insulin Abs. Isotype-matched rabbit IgG served as control for rabbit anti-Ki67 mAb. (G) Confocal microscopy shows double-immunostaining for insulin (red) and a cell proliferation nuclear marker Ki67 (green) (scale bar, 50 µm), with a high magnification (two bottom rows, scale bar 10 µm). Control CD4CD62L Treg-treated diabetic mice (top panels) showed the Ki67-positive cells distributed in the infiltrated inflammatory cells (blue, with high density), not in β-cell area (dashed pink circle), with almost complete disappearance of β cells (red). (H) Double-immunostaining for β-cell marker insulin (red) and α-cell marker glucagon (green), followed by nuclear counter-staining with DAPI (blue). Seven-week old NOD mice served as non-diabetic control to show normal islet architecture. Scale bar, 50 µm.

