
Fig. 3.
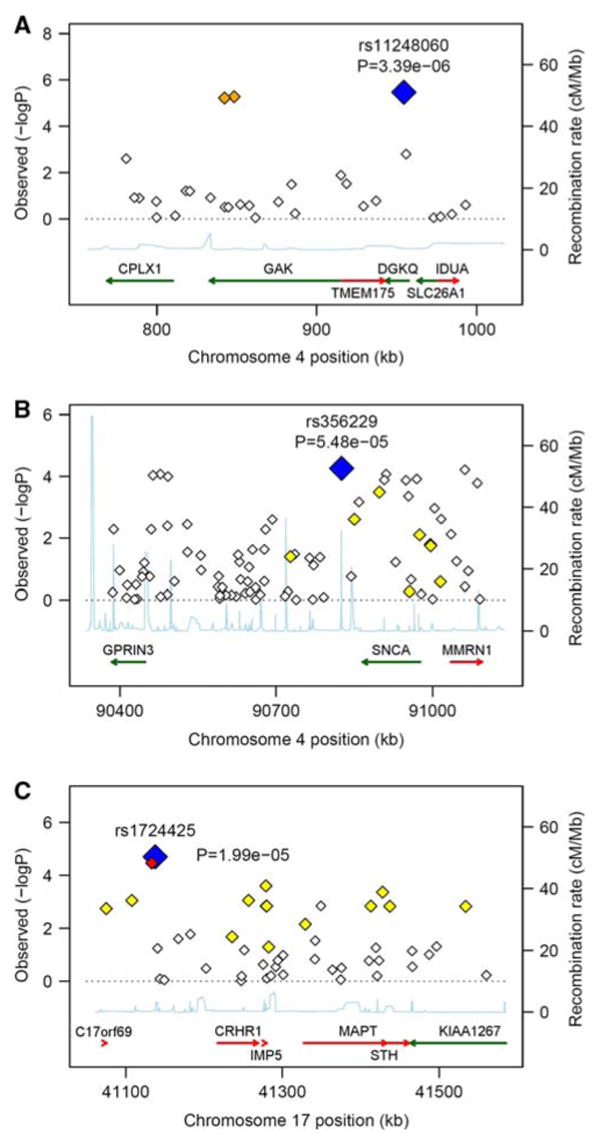
Evidence of association in particular chromosomal regions. Along the X-axis is the physical position in the region (in kB) with known genes shown in their orientation The left Y-axis denotes the association test result as −log(p value) corresponding to diamonds in the figure. The blue diamond identifies the primary SNP result labeled with an rs# and p value. The color of additional diamonds depicts the pairwise linkage disequilibrium with the primary SNP: red indicates r2 > 0.8, orange 0.5 < r2 < 0.8, yellow 0.2 < r2 < 0.5, white r2 < 0.2. r2 values were obtained from the control sample genotyped as part of this study using Haploview (Barrett et al. 2005). The right Y-axis indicates the recombination rate, obtained from the available HapMap data in the CEPH Caucasians, and shown within the figure by the solid blue line. a Additive results around GAK/DGKQ; b additive results around GPRIN3/SNCA/MMRN1; c Recessive results around C17orf69/MAPT/IMP5/STH