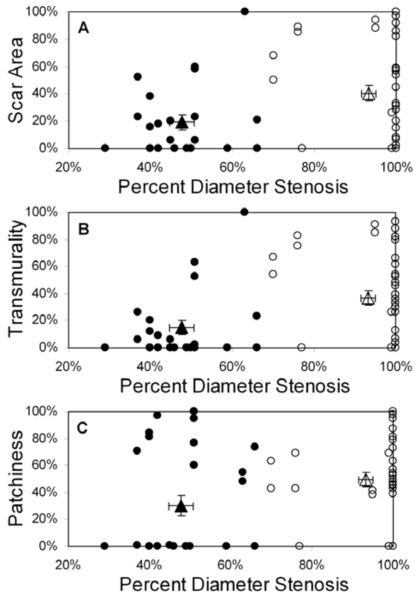
Fig. (2).
Scar area (A), transmurality (B), and patchiness (C) as functions of percent diameter stenosis for all patients (n=34); basal and mid-LV results are pooled. Patients are grouped by collateral score: score 0 (filled circles), score 1-3 (open circles). The filled triangle designates the mean value (± SEM) for the 0 collaterals group and the open triangle designates the mean value (± SEM) for the 1-3 collaterals group. Note that each scar parameter is computed within a 30° sector defined in the appropriate coronary artery distribution for each vessel group.

