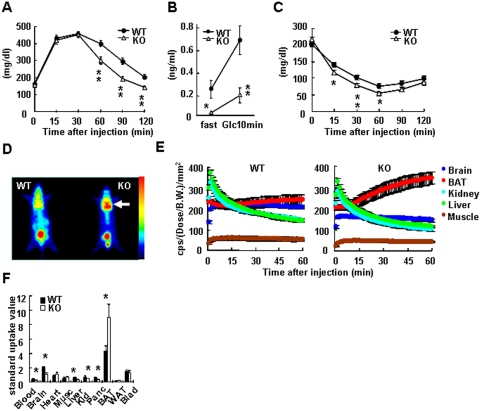
Figure 5. Improved Glucose Tolerance and Increased Insulin-Independent Glucose Uptake into KRAP−/− Brown Adipose Tissue.
(A) Intraperitoneal glucose tolerance test in age-matched pair (15–17 weeks of age) of male mice on a standard diet. n = 10; P<0.01; F (1, 18) = 12.1. (B) Serum insulin concentrations before and 10 min after the single glucose i.p. injection at a dose of 2 g glucose/kg BW. Age-matched pair (9–11 weeks of age) of male mice. n = 8–10; P<0.01; F (1, 15) = 10.8. (C) Insulin sensitivity test in age-matched pair (21–27 weeks of age) of female mice on a standard diet. n = 14–15; P = 0.07; F (1, 27) = 3.5. (D) PET image showing the enhanced accumulation of 18F-FDG in the brown adipose tissue (BAT) of KRAP−/− (KO) mice. Arrow indicates a location of the BAT. A separate experiment in the same procedure was performed on five pairs of mice and the similar results were obtained. Gradation bar indicates signal intensity. (E) Time-activity curves of 18F-FDG in BAT (red circle), brain (dark blue circle), liver (green circle), kidney (pale blue circle) and muscle (brown circle) were obtained from the mean pixel radioactivity in ROI of the images shown in (D) (n = 5). (F) Quantification of the 18F-FDG uptakes in blood, brain, heart, muscle (Musc), liver, kidney (Kid), pancreas (Panc), BAT, epididymal white adipose tissue (WAT) and bladder (Blad) after the PET imaging (n = 5). All the data are presented as mean±S.E.M.; *P<0.05; **P<0.01 compared with wild-type controls.

