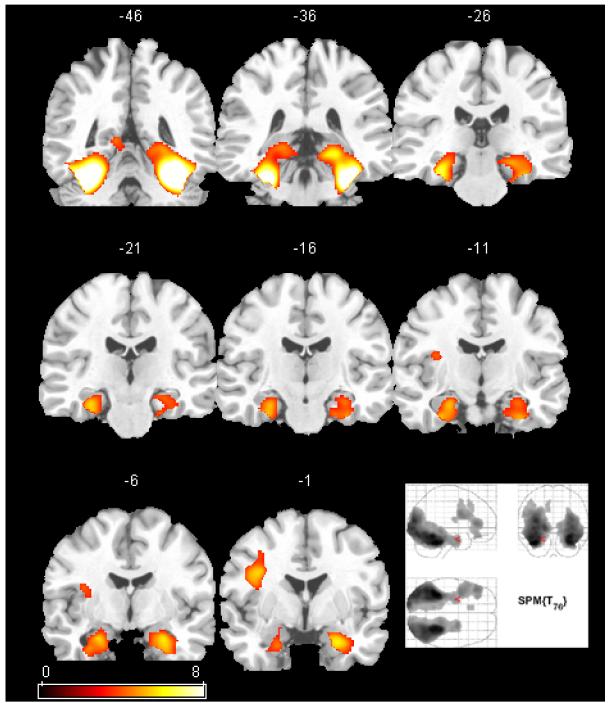
Figure 1.
The SPM(t) map of the cerebral response to novel line drawings versus previously learned drawings in 77 healthy adults (reference group). The map is thresholded using FDR correction (p<0.01). A selection of coronal views of an atlas brain are shown with y-values of the coordinate system shown above each slice (left is on left). The maximum intensity projection of the same map is shown in the bottom right. Activation is strongest in the ventral temporal lobes extending into the mesial temporal lobes bilaterally. The left lateral frontal lobe was also active.

