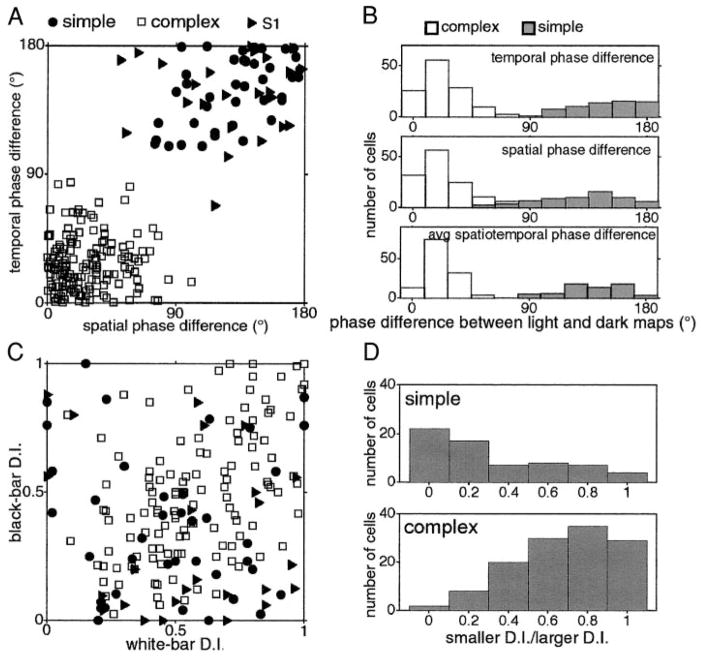
FIG. 3.
Various parameters measured for simple and complex directional cells. A: spatial and temporal phase differences for light and dark stimuli space-time maps for simple and complex cells (symbols indicate classification by qualitative assesment). B: histograms of temporal, spatial, and averaged spatial and temporal phase differences for the population of cells, showing that light/dark spatial and temporal phase differences distinguish simple from complex cells. C: direction indices to light and dark moving bars. D: ratio of light-bar or dark-bar direction index (DI; whichever is smaller) to DI for the other contrast.

