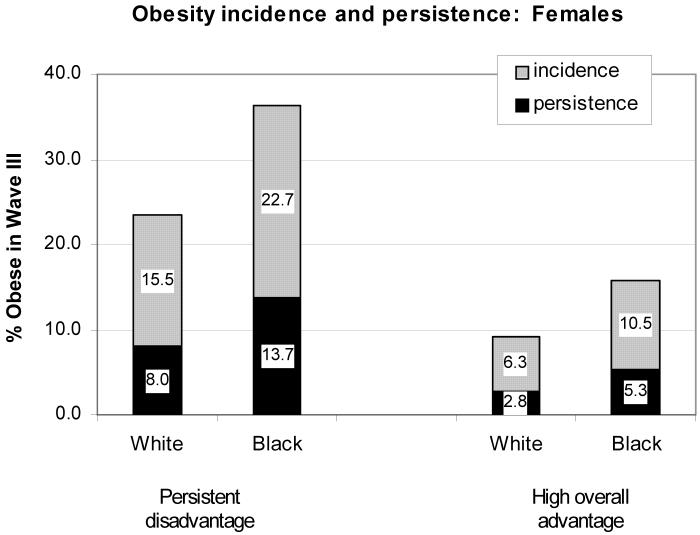
Figure 2.
Predicted* longitudinal obesity patterns from Wave I (1994-1995) to Wave III (2000-2001) for white and black females from the National Longitudinal Study of Adolescent Health, across selected life course SES groups
*Coefficients from the multinomial logistic regression model estimating relative risk of longitudinal obesity patterns in females were used to predict the probability of obesity incidence (becoming obese from Wave I to Wave III) and persistence (staying obese from Wave I to Wave III), for a 22-year old female of specified race/ethnicity and life course SES groups, holding all other variables constant.

