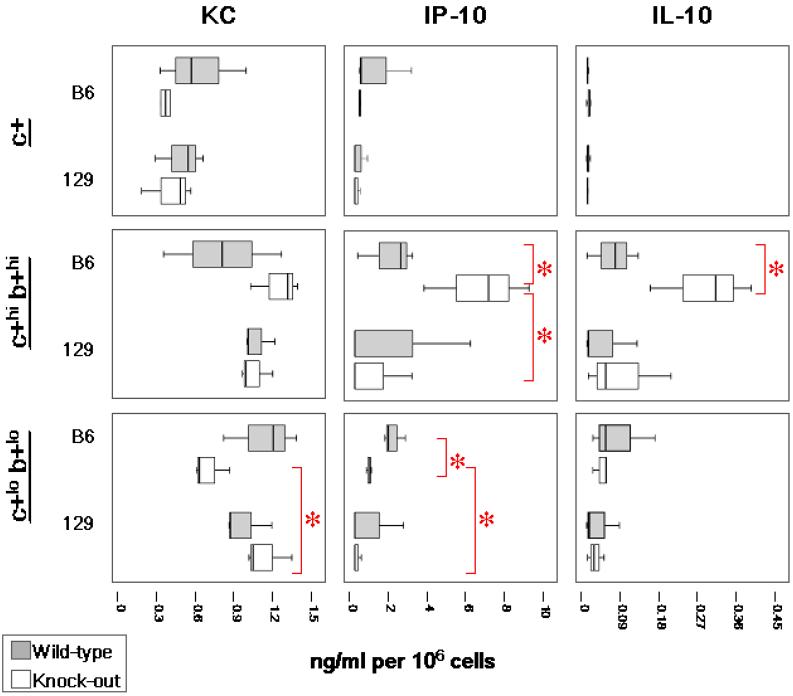
Figure 7b.
Cytokine production by sorted BMDCs following CpG-ODN stimulation. BMDCs were sorted according to CD11c and CD11b expression. Experiments represent at least 3 animals per strain and genotype. Three distinct subtypes: (1) single-positive/CD11c+ CD11b- (c+), (2) double-hi/CD11c+hi CD11b+hi, and (3) double-lo/ CD11c+lo CD11b+lo. Cell culture supernatants were assayed for cytokine production 24h post-stimulation. Data in box-plots with median (heavy line inside box), interquartile range (box) and range (error bars). Intergroup comparisons yielding significantly different levels of cytokines are represented (*red bars, P<0.05)

