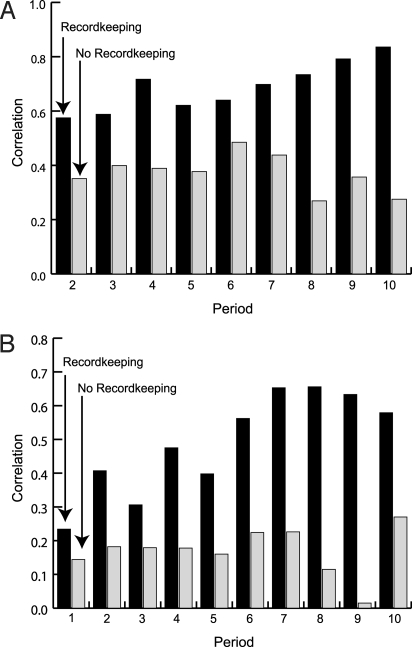
Fig. 1.
Correlation between decisions and image scores across time. (A) Mean session correlation of period t Investment with period t-1 trustee image score. Shown is the average of session mean correlation between period t investment and the period t-1 trustee image score for periods 2 through 10 for the recordkeeping and no recordkeeping economies. (B) Mean session correlation of period t ROE with period t investor image score. Shown is the average of session mean correlation between period t return on endowment and the period t investor image score for periods 1 through 10 for the recordkeeping and no recordkeeping economies.

