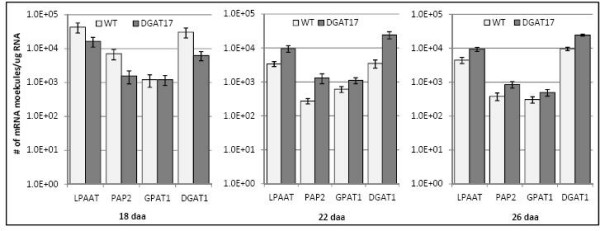
Figure 5.

Expression pattern of genes implicated in lipid-related processes in transgenic line DGAT#17 and untransformed control. All values represent the average of 3 biological replicates, each analyzed twice (technical replicates) ± SE. 18 daa, 22 daa and 26 daa; Gene expression examined at 18, 22 and 26 days after anthesis, respectively. GPAT, glycerol-3-phosphate acyltransferase; LPAAT, lyso-phosphatidic acid acyltransferase; PAP, phosphatidate phosphatase; DGAT, diacylglycerol acyltransferase; WT, untransformed control (cv. Quantum).
