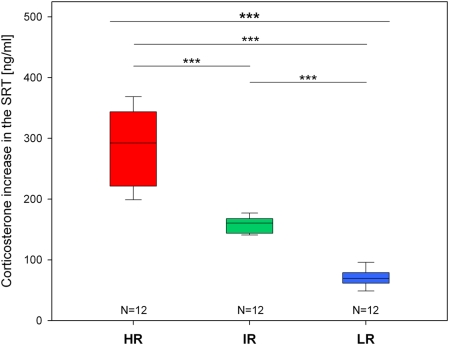
Figure 1. Corticosterone increase in the stress reactivity test (SRT) of the experimental animals selected from the seventh generation of the high (HR), intermediate (IR) and low (LR) reactivity mouse lines.
Data are given as box plots showing medians (lines in the boxes), 25% and 75% percentiles (boxes) as well as 10% and 90% percentiles (whiskers). Statistical differences between the three lines (KWH-test, for details see text) are given at the top of the panel and results of the pairwise group comparisons (post-hoc MWU-tests) are indicated below (Bonferroni corrected p<0.001 ***).

