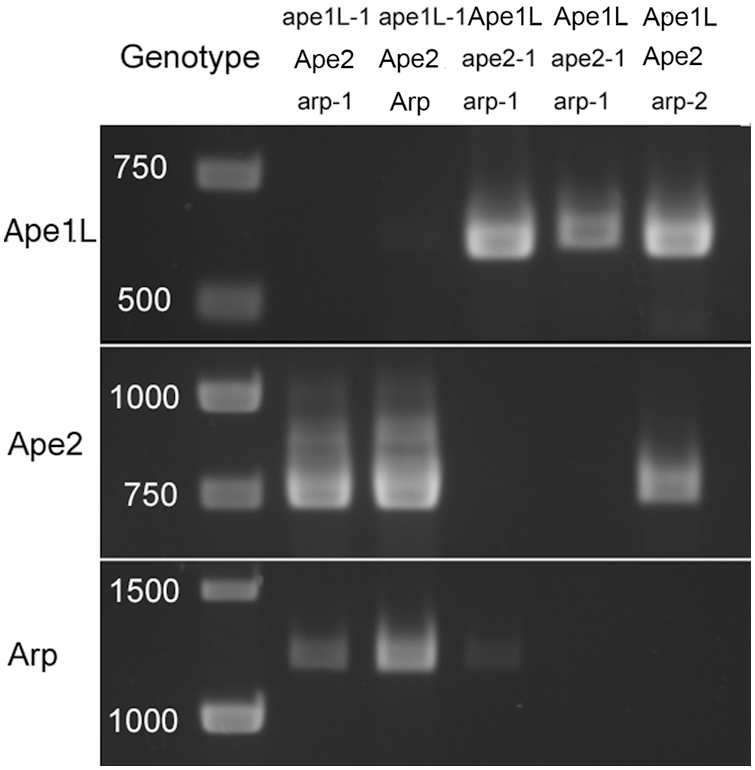
Figure 2. Expression of Ape1L (top), Ape2 (middle), and Arp (bottom) genes.

RT-PCR used template RNAs extracted from a selection of strains. Genotype of each strain, indicated by PCR analysis of extracted DNA, is shown at the top. In each strain with a T-DNA insertion, ape1L-1, ape2-1, and arp-2, accumulation of transcript of the corresponding gene was undetectable. RNA accumulation differed among the arp-1 base-substitution strains.
