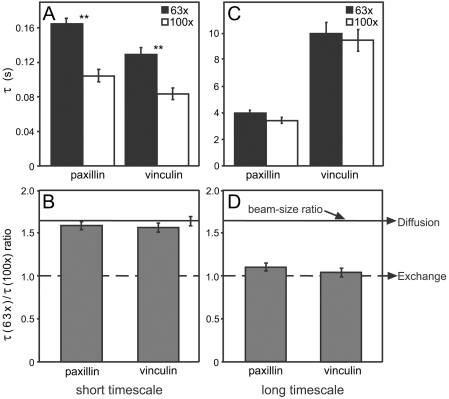
Figure 2. FRAP beam-size analysis reveals two different recovery modes inside FAs.
FRAP experiments were conducted on HeLa-JW cells expressing paxillin-YFP or mCherry-vinculin, as described in Figure 1. Two beam sizes were generated using 63× and 100× objectives, and τ values were determined with each. The ratio between areas illuminated by the two beams was 1.63±0.03 (n = 59); this ratio is expected for FRAP by lateral diffusion, whereas a ratio of 1 is expected for recovery by exchange [23]. (A) τ values derived from FRAP experiments on a short timescale (3 s). For both paxillin and vinculin, the τ(63×) differed significantly from the τ(100×) value of the same protein (**, p = 2×10⁻⁷; Student's t-test). (B) τ(63×)/τ(100×) ratios derived from (A). The τ ratio for the 3 s measurements yielded 1.59 for paxillin and 1.58 for vinculin, close to the 1.63 ratio expected for lateral diffusion (solid line) (p = 0.24 and 0.15 for paxillin and vinculin, respectively; Student's t-test). (C) τ values from FRAP experiments on long timescales (60 or 160 s). For both proteins, the τ(63×) and τ(100×) values of the same protein were similar (p = 0.38; Student's t-test). (D) τ(63×)/τ(100×) ratios derived from (C). The τ ratios (1.09 for paxillin, 1.05 for vinculin) differed significantly from the 1.63 value for diffusion (p = 4*10−23 and 4*10−25 for paxillin and vinculin, respectively; Student's t-test). These values imply a major contribution of exchange to the recovery, as they are close to the ratio of 1 predicted for pure exchange (broken line). Bars in (A) and (C) represent means±SEM of 30–60 measurements. In (B) and (D), SEM of the τ(63×)/τ(100×) ratios were calculated using bootstrap analysis.

