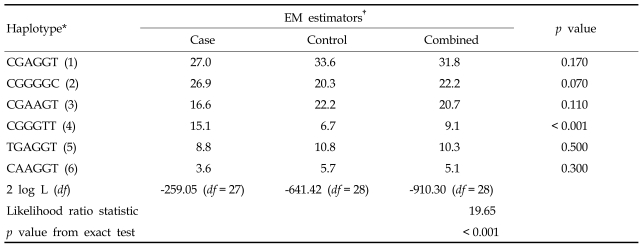
Table 4.
The Distribution of Haplotypes in APOA5 (-1390C>T, -1020G>A, -3A>G, V150M, G182C and 1259T>C) and Results of Likelihood Ratio Tests
The exact test statistic for testing the haplotypes at these markers for association with disease status is calculated as 19.65 = 2 (-641.42 - 259.05 + 910.30) with degrees of freedom 27 = 28 + 27 - 28, which has a p < 0.001.
*Denote haplotype corresponding to pair of CGAGGT, CGGGGC, CGAAGT, CGGGTT, TGAGGT, CAAGGT, CGAGTT.
†More than 1% of frequency.

