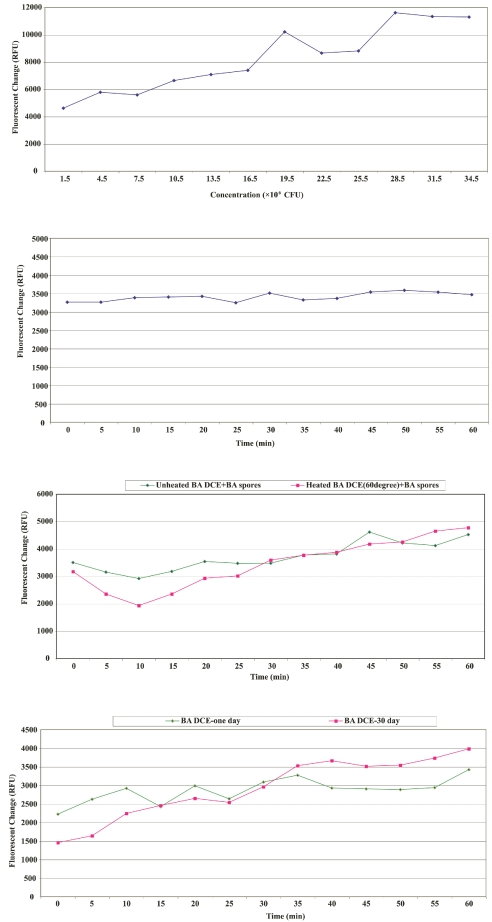
FIGURE 2.
A: Fluorescence change of Bacillus anthracis DNA capture element (Ba DCE) vs. concentration change of Ba spores. B: Fluorescence change of Ba DCE vs. time from interaction of Ba DCE with 1.2 × 10⁶ CFu/μL of Ba spores. C: Thermal stability study of Ba DCE. Ten microliters of Ba spores (1.5 × 10⁵ CFU/μL) were used for both Ba DCE experiments. The red line is from Ba DCEs that were heated for 4 h at 60°C. D: Stability study of Ba DCE. Ten microliters of Ba spores (1.5 × 10⁵ CFU/μL) were used for both Ba DCEs experiments. The red line is from Ba DCEs that were kept for 30 d at room temperature.

