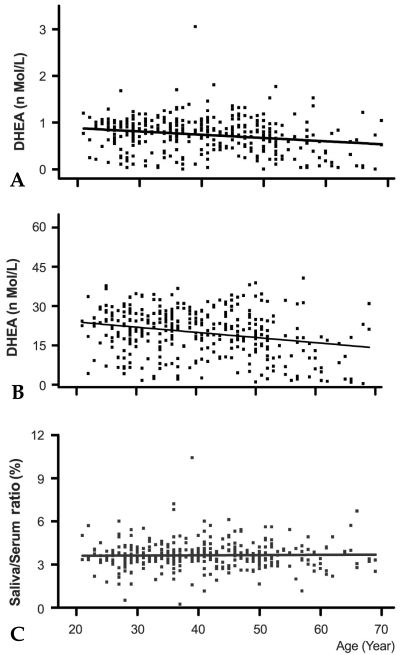
Fig. 2.
Age-related basal DHEA level changes in saliva (A) and serum (B). Samples were collected at 10 to 11AM. Cortisol levels in 358 paired saliva and serum samples were determined with RIA. Each point on the figure represents cortisol levels of a participant. The relative DHEA ratio of serum to saliva is depicted in (C). The indicated line represents the best fit linear regression with age. Predicted salivary DHEA level (nmol/L) = 1.009-0.007x, beta = -0.21, p #x003C; 0.001, n = 356; predicted serum DHEA level (nmol/L) = 27.9-0.197x, beta = -0.25, p #x003C; 0.001, n = 359; predicted saliva/serum ratio = 3.58+0.0016x, beta = 0.18, p = 0.73, n = 359.

