Fig. 2.

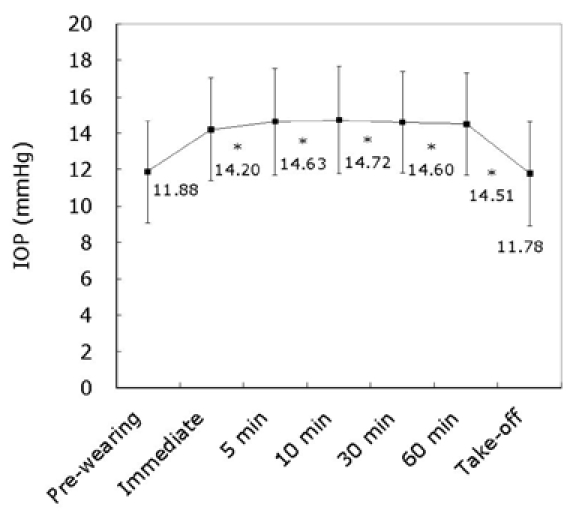
Mean IOP (mean ± SD) change before and while the goggles were worn, and after they were removed(Repeated measures of ANOVA with Bonferroni correction, *p < 0.05).

Mean IOP (mean ± SD) change before and while the goggles were worn, and after they were removed(Repeated measures of ANOVA with Bonferroni correction, *p < 0.05).