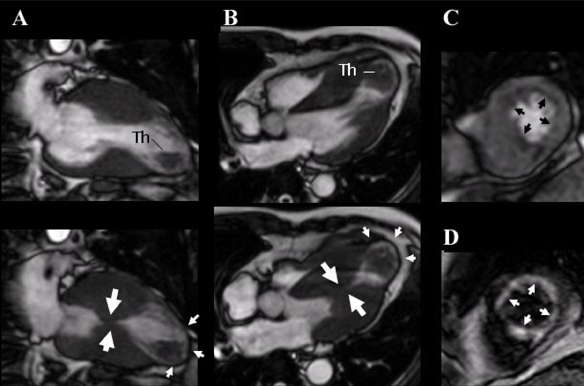
Fig. 3.

ECG-gated, cine magnetic resonance imaging of the long axis (A) and 4-chamber view (B), showing mid-ventricular obstruction during systole (large arrows) (lower panels), an apical aneurysm (small arrows), and a thrombus (Th, upper panels) during diastole. Contrast-enhanced first-pass myocardial perfusion (C) and delayed enhancement (D) images, showing a subendomyocardial perfusion defect (arrows) and delayed enhancement (arrows), respectively.
