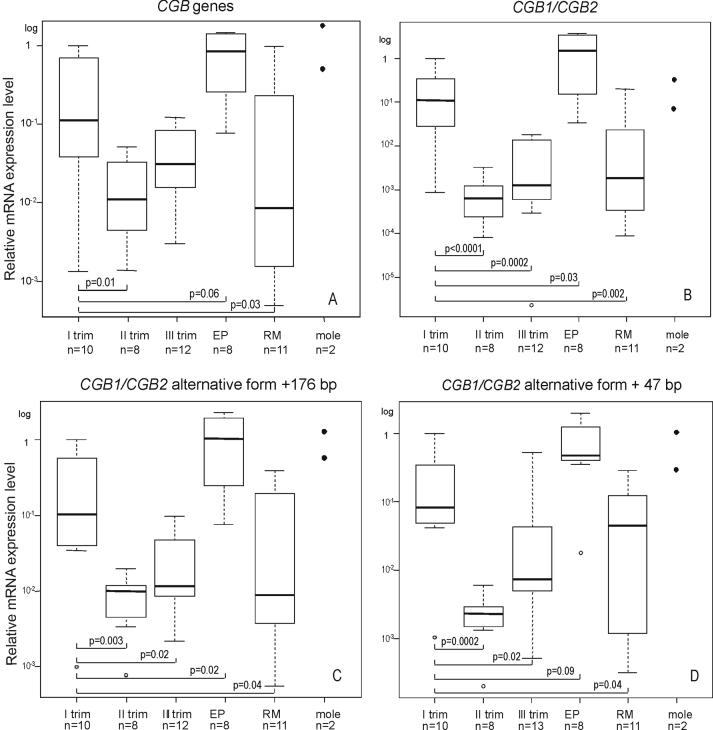
Figure 3.
Notched box plot for the distribution of the relative expression level of CGB transcripts in placenta during the first, second and trimester of normal pregnancy, in case of recurrent miscarriage (RM), ectopic pregnancy (EP) and molar pregnancy. The boxes represent the 25th and 75th percentiles. The median is denoted as the line that bisects the boxes. The whiskers are lines extending from each end of the box covering the extent of the data on 1.5 X interquartile range. Circles represent the outlier values. P-values reflecting the differences between groups are shown.
Relative mRNA quantization with real-time RT-PCR comparative Ct method for A, summarized CGB genes transcription; B, CGB1/CGB2 transcripts; C, D CGB1/CGB2 +176 bp and CGB1/CGB2 +47 bp alternative forms. The trophoblastic sample with highest summarized transcription activity of CGB genes from first trimester normal pregnancy is used as calibrator sample.

