
Figure 4.
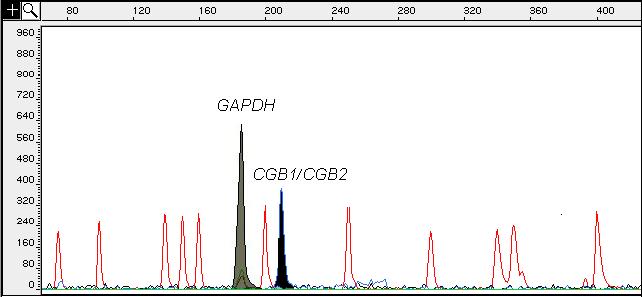
Gene Scan Fragment Analysis electrophoretogram showing the amplified fluorescent-labeled products of CGB1 and CGB2 (6-FAM; 207 bp, black peak) gene and GAPDH (HEX; 196 bp, grey peak) from cDNA of a single blastocyst material. The x-axis shows the size of the detected fragments in base pairs (bp), and the y-axis represents the relative intensity of fluorescence (RFU). The empty peaks mark the GeneScan-500 TAMRA internal size standard.