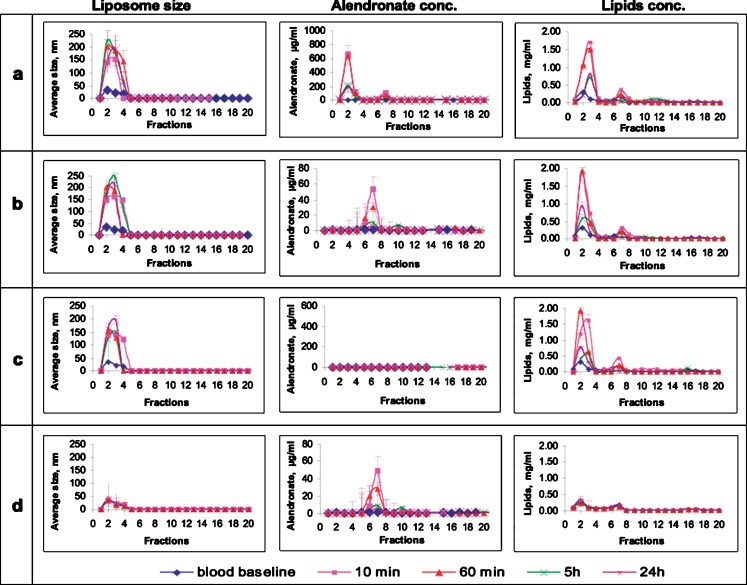
Fig. 3.
In vivo elution profile (size-exclusion chromatography columns) of alendronate liposomes as function of size (diameter, left column), alendronate concentration (middle column), and lipid concentrations (right column) in specimens recovered over time from rabbits’ blood following IV injection (30 mg/kg) of a alendronate liposomes, b empty liposomes spiked with alendronate (30 mg/kg), c empty liposomes, and d free alendronate (30 mg/kg). See legend of Fig. 2 for additional information regarding fractions and detection

