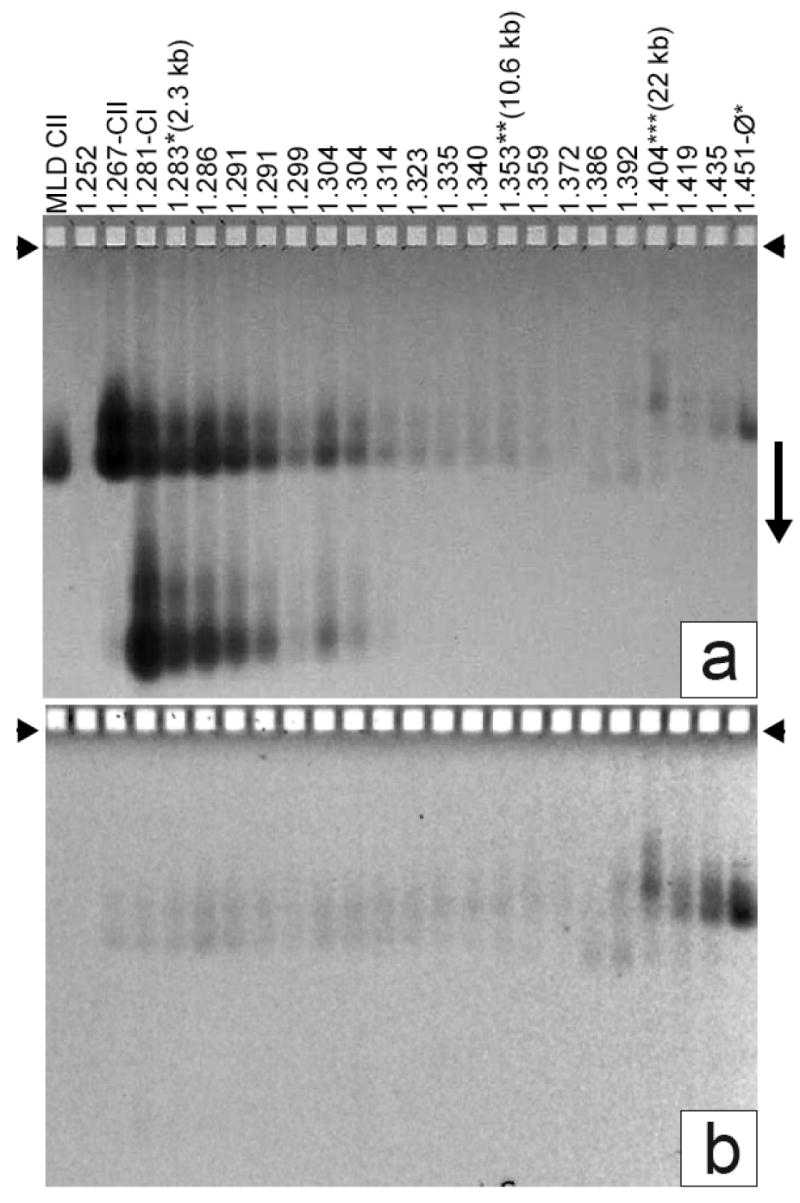
Figure 3.

Detection of ipDNA-capsids by AGE. Fractions of a cesium chloride density gradient (Figure 2b) were analyzed by AGE. The gel was stained with (a) Coomassie blue after it had been stained with (b) ethidium. A number above a lane indicates the density of the sample (g/ml). MLD capsid II was also analyzed (leftmost lane). Capsid I and capsid II are labeled as CI and CII, respectively, on top of the lanes. The three samples (density gradient fractions) used to image ipDNA-capsids by cryo-EM are labeled at the top with their corresponding ipDNA lengths. Other density gradient fractions also had ipDNA-capsids, but these were not subjected to cryo-EM.
