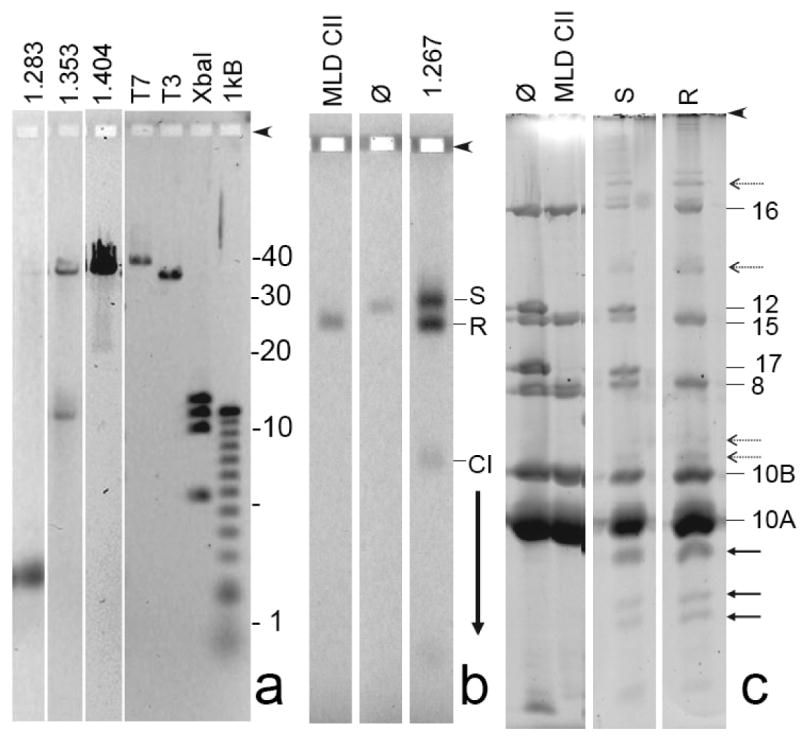
Figure 4.

Preliminary characterization of ipDNA-capsids. (a) DNA from samples of 1.283, 1.353, and 1.404 g/ml ipDNA-capsids was expelled from capsids and subjected to high-resolution agarose gel electrophoresis. The following standards are in the rightmost four lanes: T7, mature T7 DNA (39.937 kb); T3, mature T3 DNA (38.208 kb); XbaI, a T7 XbaI digest (5.64; 10.10; 11.37; 12.83 kb), and 1 kB, a 1 kb ladder obtained from Invitrogen. (b) A sample of 1.267 g/ml ipDNA-capsids was removed from a cesium chloride density gradient (Figure 2b), stained with Alexa 488 and then subjected to non-denaturing agarose gel electrophoresis, as in Figure 3. (c) Gel fragments with particles of both the slow and rapid capsid II bands were separately sliced from the agarose gel in (b) and subjected to SDS-PAGE and then stained with SYPRO Ruby (S and R lanes, respectively). Additional lanes during SDS-PAGE have the following samples that had not been subjected to agarose gel electrophoresis (lane marking, followed by sample): ϕ, bacteriophage T3; MLD CII, MLD capsid II. Proteins from the polyacrylamide gel in Figure 4c were eluted, digested with trypsin and analyzed by mass spectrometry, as described in the Materials and Methods Section. Proteins identities (numbers) are marked on the right side.
