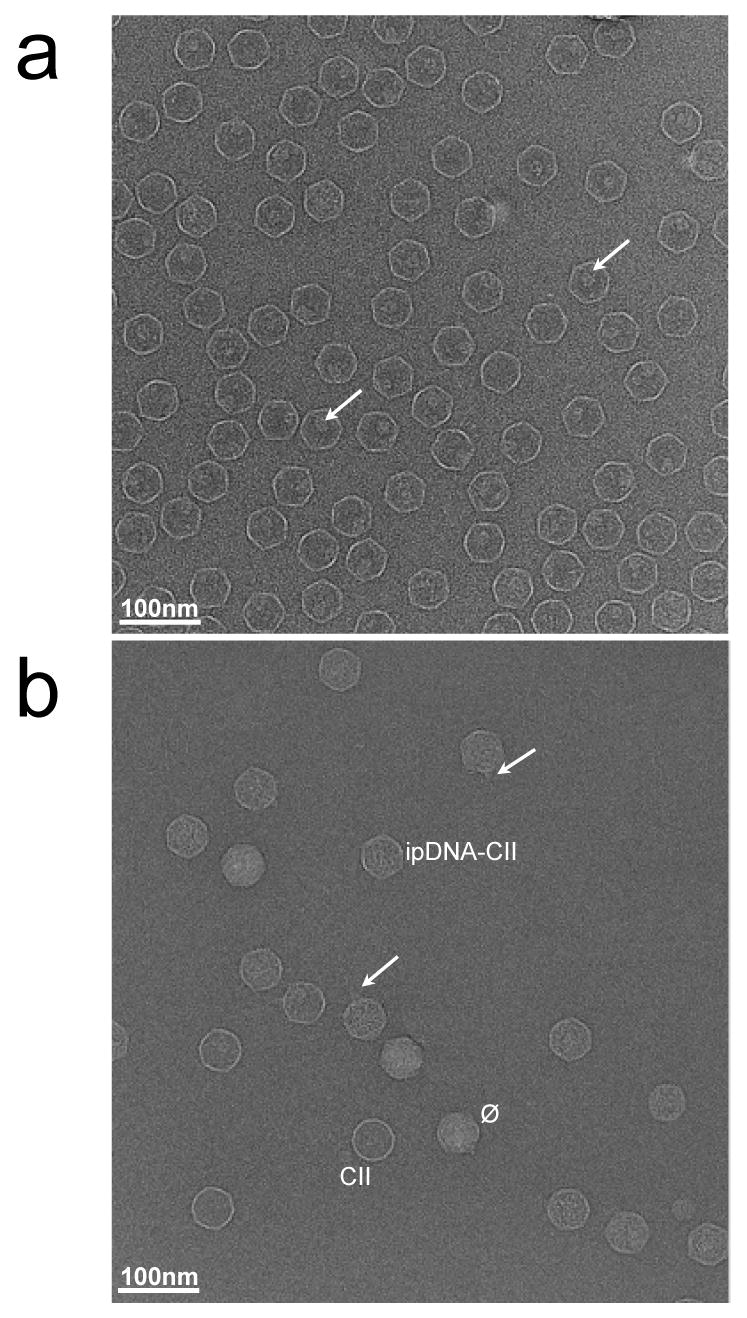
Figure 5.

Cryo-electron microscopy of T3 capsids. Fields are shown of (a) MLD capsid II at 3.4 μm defocus and (b) 10.6 kb ipDNA-capsids at 2.5 μm defocus, as described in the Materials and Methods section. The length of the bar is 100 nm. The arrows in (a) point to the internal cylindrical shaped density in the capsid. The labels in (b) mark particles representative of the different types of capsids. The arrows in (b) point to tails on the ipDNA-capsids.
