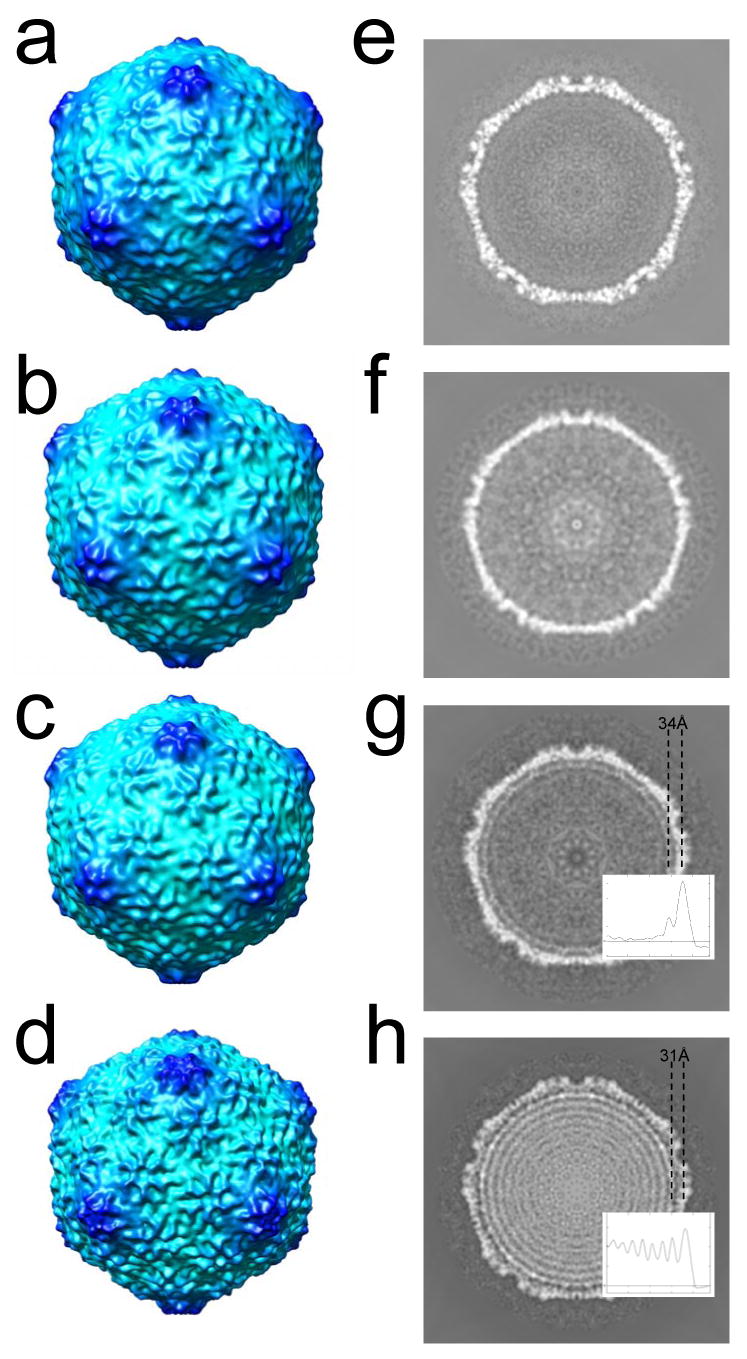
Figure 7.

3-D icosahedral reconstructions of particles observed by cryo-electron microscopy. The 3-fold surface views are shown for the 3-D reconstruction of (a) MLD capsid II; (b) 10.6 kb ipDNA-capsid; (c) 22 kb ipDNA-capsid; (d) bacteriophage T3. The central cross sections perpendicular to the 5-fold axis are shown for the 3-D reconstructions of (e) MLD capsid II; (f) 10.6 kb ipDNA-capsid; (g) 22 kb ipDNA-capsid; (h) bacteriophage T3. The average distance between the center of the protein shell and that of the first DNA ring is indicated for the 22 kb ipDNA-capsid (g) and bacteriophage T3 (h). The radial density profile of 22 kb ipDNA-capsid and mature phage is also shown in (g) and (h) respectively to measure the distance between the peaks for the protein shell and the outmost DNA ring.
