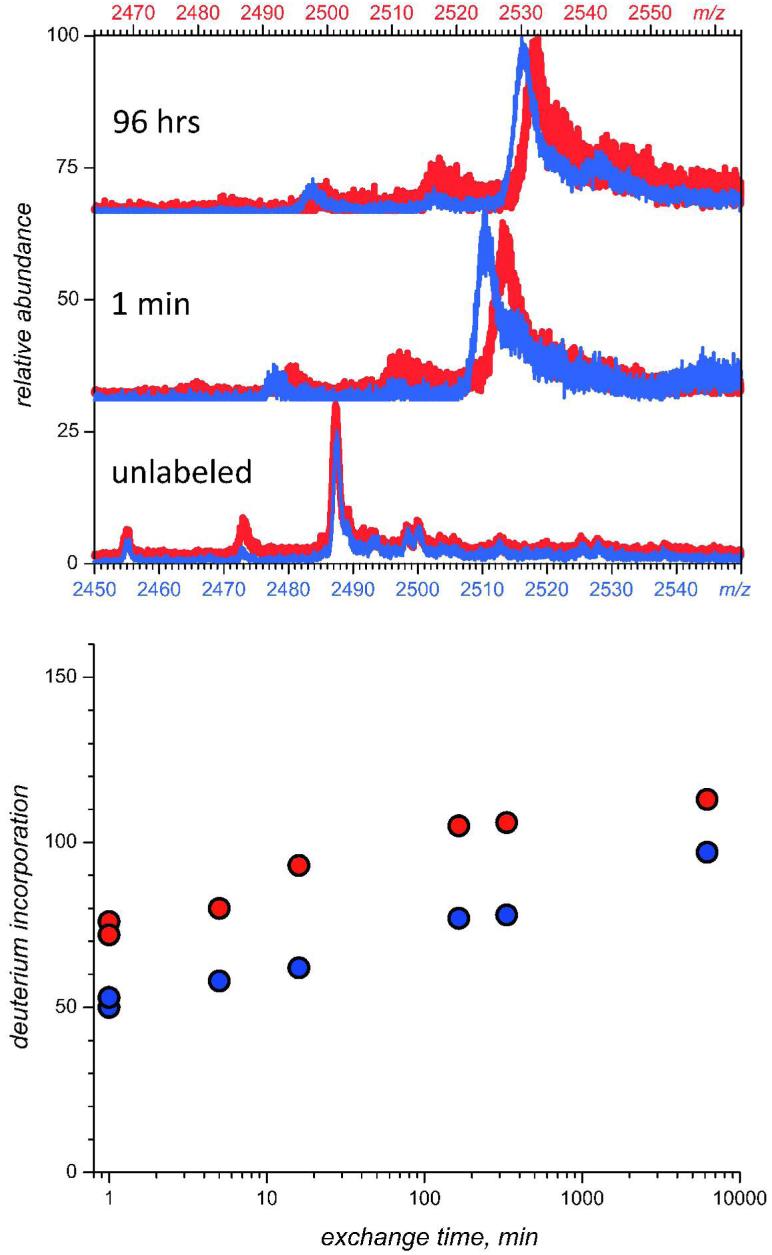
Figure 3.
Global HDX kinetics of intact IFN-β1a (blue) and NEM-IFN-β1a (red). The top panel shows raw HDX MS data (charge state +9), where the m/z scale for IFN-NEM ions was offset such that the observed difference in the ion peak position is due to the different rates of deuterium incorporation. Using the same color coding, the bottom panel shows the incorporation of deuterium by each protein versus time, calculated as described in the materials and methods.

