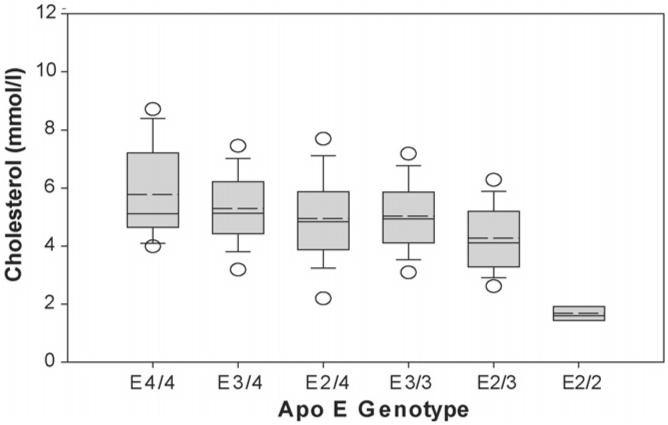
Fig. 2.
Peak LDL cholesterol concentration by apo E genotype. The cholesterol concentrations of the LDL peak (sum of cholesterol concentration in fractions 9-14 comprising the majority of the peak) of the E4/4 subjects (n = 22), E3/4 subjects (n = 262), E2/4 subjects (n = 30), E3/3 subjects (n = 710), E2/3 subjects (n = 151) and E2/2 (n = 6) were obtained from the lipoprotein distribution isolated by density gradient ultracentrifugation. The median (—) and the mean (- -) are indicated. The lower and upper end of the box indicates the 25th and 75th percentile, respectively. The lower and upper end of the error bars represent the 10th and 90th percentile, respectively. The lower and upper dots are the 5th and 95th percentile, respectively. See Table 3 for significance of differences between the cholesterol in the LDL peak between apo E genotypes.

