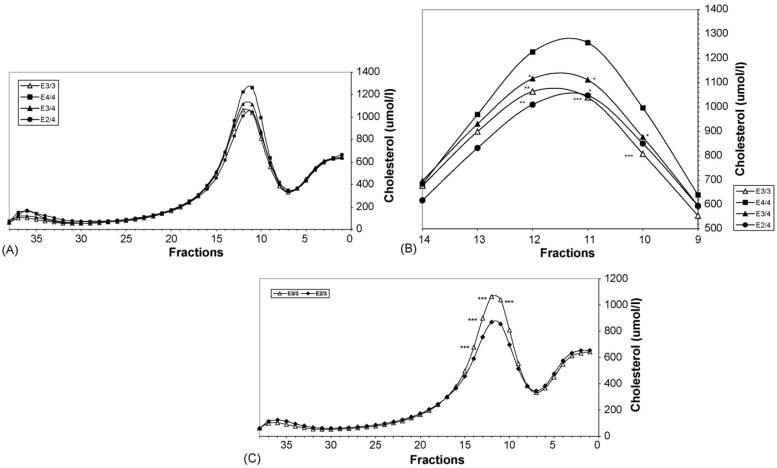
Fig. 3.
(A) Plasma lipoprotein distribution of E4/4, E3/4, E3/3 and E2/4 genotypes obtained by density gradient ultracentrifugation. Plasma lipoproteins of E4/4 subjects (n = 22) (▀), E3/4 subjects (n = 262) (▴), E3/3 subjects (n = 710) (△) and E2/4 subjects (n = 30) (●) were isolated by density gradient ultracentrifugation and the cholesterol content of each fraction was analyzed. See Fig. 1 legend for location of VLDL, IDL, LDL and HDL. (B) Cholesterol distribution in LDL peak (Fractions 9-14). The LDL cholesterol distribution of fractions 9-14 of E4/4 subjects (n = 22) (▀), E3/4 subjects (n = 262) (▴), E3/3 subjects (n = 710) (△) and E2/4 subjects (n = 30) (●) was magnified from (A) and significance differences in the cholesterol content of the fractions relative to E4/4 are indicated (*p≤0.05, **p ≤ 0.01, ***p ≤ 0.001). Lipoproteins were isolated by density gradient ultracentrifugation and the cholesterol content of each fraction was analyzed. (C) Plasma lipoprotein distribution of E3/3 and E2/3 subjects obtained by density gradient ultracentrifugation. Plasma lipoproteins from E3/3 subjects (n = 710) (△) and E2/3 subjects (n = 151) (◆) were isolated by density gradient ultracentrifugation and the cholesterol content of each fraction was analyzed. Significance differences in the cholesterol content of the fractions of E3/3 compared to E2/3 are indicated (***p ≤ 0.001). See Fig. 1 legend for location of VLDL, IDL, LDL and HDL.

