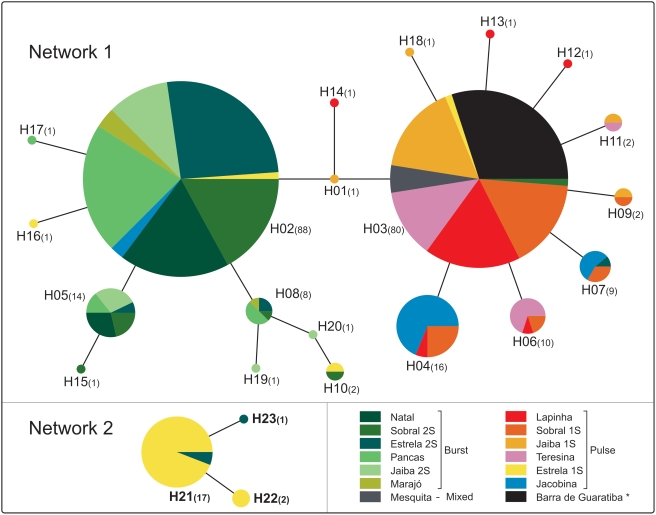
Figure 4. Haplotype networks of the L. longipalpis haplotypes from Brazil.
Each L. longipalpis population is represented by one color. Each node (pie diagram) represents a unique haplotype (see Table S4). The number of sequences represented in each node is shown in brackets.

