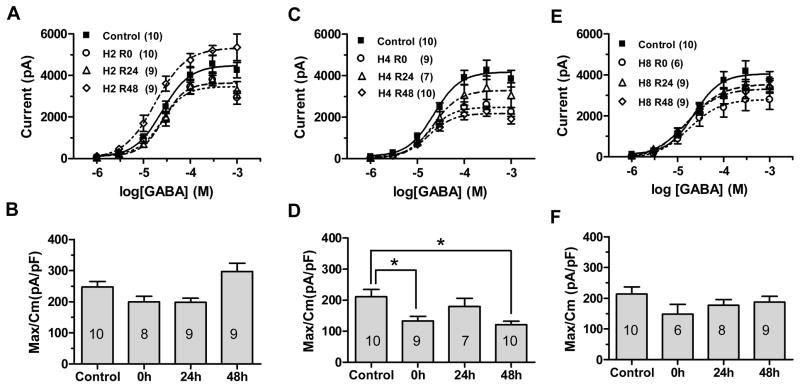
Figure 2.
GABAAR current after 2 h, 4 h or 8h hypoxia. Peak currents elicited by increasing GABA concentrations in control cells (filled squares) and immediately (0 h, open circles), 24 h (open triangles) and 48 h (open diamonds) after 2 h hypoxia (A), 4 h hypoxia (C), or 8 h hypoxia (E). Each symbol represents means of peak currents evoked at that GABA concentration. Maximal GABA currents normalized to cell capacitance for control cells and at each recovery time points after 2 h hypoxia (B), 4 h hypoxia (D) or 8 h hypoxia (F). Bars represent mean ± SEM; the n for each condition is shown in the appropriate bar. There was no significant difference in current density between control and 2h or 8h hypoxia-treated cells at any recovery time after hypoxia (p>0.05, one way ANOVA). Current density was significantly reduced at 0 h and 48 h recovery after 4 h hypoxia (D). Asterisks show columns significantly different from each other as marked (*p < 0.05, **p<0.01, ***p<0.001 compared to control by one way ANOVA).

