Figure 4.
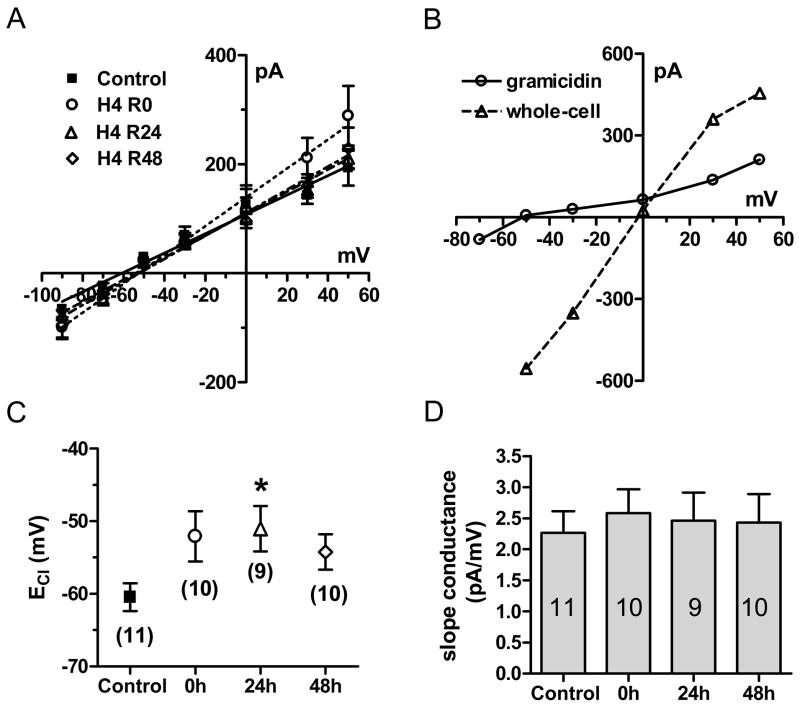
Hypoxia (4 h) shifted the reversal potential of GABA-induced Cl− currents (ECl). (A) GABA current-voltage relationship in control conditions (filled squares), immediately following 4 h hypoxia (0 h, open circles), 24 h (open triangles) and 48 h (open diamonds) recovery after 4 h hypoxia. (B) Sample I–V relationship of GABA currents in gramicidin perforated-patch and whole-cell patch mode in a single cell recorded 24 h after 4 h hypoxia. (C) The changes in ECl were significantly different between control and 24 h recovery time point. Data represents mean ± SEM; the n for each condition is shown in the appropriate symbol; Asterisks show columns significantly different from each other as marked (*p < 0.05 compared to control by one way ANOVA with post-hoc t test). (D) There was no significant difference in slope conductance after 4 h hypoxic exposure compared with control (ρ>0.05, one way ANOVA).

