
Figure 6.
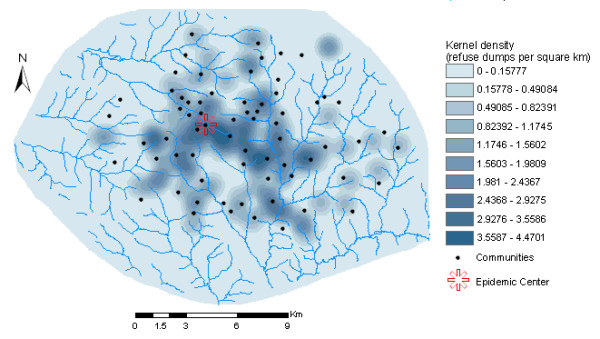
Kernel density surface (after neighbourhood statistics), showing the number of refuse dumps per unit area.
Official websites use .gov
A
.gov website belongs to an official
government organization in the United States.
Secure .gov websites use HTTPS
A lock (
) or https:// means you've safely
connected to the .gov website. Share sensitive
information only on official, secure websites.
Kernel density surface (after neighbourhood statistics), showing the number of refuse dumps per unit area.