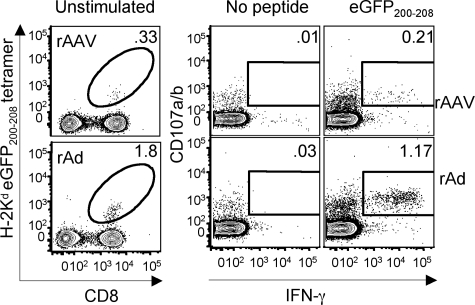
Figure 3.
Functional analysis of splenic eGFP-specific CD8+ T cells. The percentage of splenic CD8+ T cells staining with eGFP200-208 tetramer 56 days after intramuscular rAAVeGFP or rAdeGFP inoculation is indicated (left panel). The frequency of CD8+ T cells that coexpressed IFN-γ and CD107a/b after 6 hours in the presence or absence of eGFP200-208 peptide is also shown (right panel). Data are representative of 3 experiments each with spleens pooled from 5 animals. Dot plots gated on FSC/SSC appropriate for lymphocytes, LIVE/DEAD Blue−CD4−B220−F4/80−CD3+ (left panel) and CD8+ (right panel) cells.

