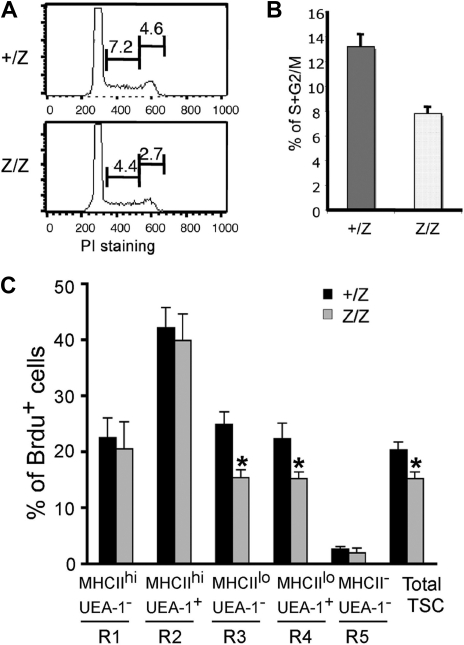
Figure 6.
Reduced proliferation of CD45- TSCs in Foxn1lacZ mutant mice. (A) CD45− TSCs from 2-week +/lacZ and lacZ/lacZ thymi stained for propidium iodide and analyzed for cell cycle. The percentage of the populations at S and G2/M phases was reduced in lacZ/lacZ thymus. (B) Quantitative summary of CD45− TSCs at S and G2/M phases. N = 3, P < .05, standard error is indicated. (C) BrdU analysis of proliferation on different thymic stromal subsets of +/lacZ, lacZ/lacZ, and lacZ/nu at 1 month (Figure 4E gates; Figure S5, histogram of Brdu+ cells).

